The visualisation of people checking in
 With this short article I don’t mean to tell you what you can do with location applications like Foursquare or Gowalla, I’d like to show you that there is really something going on. Whether you ‘believe’ in services like these or not, the fact remains that these services are growing and generating data. But what is that data, how can we grasp the fact that people seem to be moving around and registering their movement? The obvious solution lies in visualisation, so this is exactly what I’d like to show you.
Where are people going?
It’s actually not all that easy to see how people are moving through their towns even though the data is readily available. One will need to process the history of checkins and/or process new checkins on a real time basis. Fortunately, examples of services doing this are starting to rise up. First and foremost there is google maps. If you’re using foursquare you can go directly to their feeds section and copy the KML feed directly in the ‘search maps’ bar in Google Maps. This will display an overview of your recent checkin history mapped onto the Google Maps map.
A similar service is offered by 4mapper, which both maps your checkins on a Google map via a nice interface and it displays some additional statistics as well. You can see other people’s checkins here and check out the extra activity data it displays for each user.
See people moving
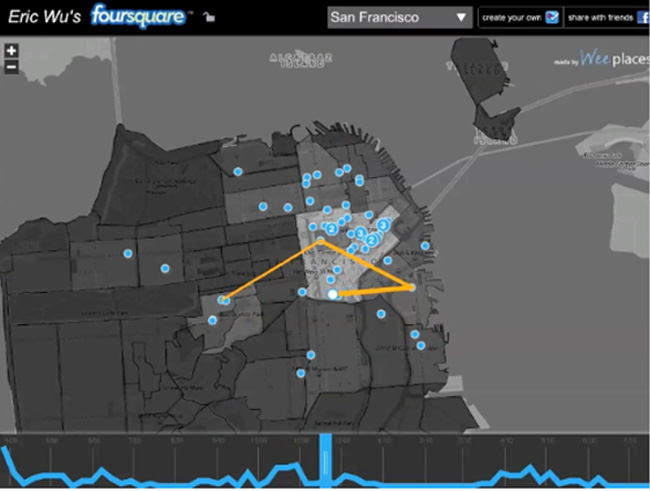
Displaying checkins on a map gives you a nice overview already, but it brings up an additional question: how are people moving over time? This question is partly answered by Weeplaces, an excellent service that will map your checkins as well but it also displays your movement over time. Check out their website for an example; for each user they will create an animation that displays checkins over time and it enlarges places that you frequently visit. A service that tries to put the notion of ‘hot places’ to use is Buzzd. Unfortunately not available for me, Buzzd will tell you what the hot places to go are in your nearby area. This way Buzzd actually combines the visualisation of checkins with an actual ‘use’ of location based services: it determines which are the places to be at the moment and feeds this aggregated information back to its users.
The notion of ‘hot’ is also used in the ‘Hot in the city’ project by the Digital Methods Initiative. Instead of a website this project involves actual LED’s on a map of the city of Amsterdam. Although designed for real-time use the example they show on their website uses Foursquare data gathered over 24 hours for dramatic effect. Have a look here for a movie of the visualisation in a project that truly displays the movement of people through a city.
Why are people moving?
The next step in visualization and data analysis would be to see why people are moving. Read this article on Location-Based Linkage on Serial Consign for some thoughts on new directions we can take from here. As they point out, the challenge is to broaden the visualisations and thus give new meanings to these checkins. Especially when you can process this data real time, interesting things come to mind. New things to learn are for example the place where people do not move to (or do not check in to) either always or on certain times during the day. Or imagine trying to display sudden rises in checkins to new hot spots like traffic accidents or concerts. This way we can take a new step in giving meaning to the data that people generate as they check in to places.
Thanks to Anne Helmond for giving me some additional links. Be sure to check out her website if you are interested in visualisations of online data.
Image taken from weeplaces.com
Amazing post. Some time back read a blog, which talked about searching people via Foursquare. Such Location based apps are surely hear to stay for a longer period. Wonder what’s in store next. It would be interesting to know how we use the data. Being in recruitments, i guess it will be an intresting tool 🙂 Although its early, but you never know, it can pick up. See what happned to Twitter and Facebook 🙂
Thank you.
In the sense of ‘searching’ people it is strange to see that Foursquare has actually made it harder to see from their website which people have checked in over time to a certain venue. Instead they seem to move to both more real time focused checkins (X people are here) on the one hand and aggregated more general data that services like described in this post can use on the other.
In some sense that makes it more interesting because it forces you to focus on what the movement of people means.